The APDL Legality Status page displays multiple pieces of important legality information at a glance. You can reach this page by tapping on the legality lozenge on any page in APDL.
At the top of this page you can navigate between days of your trips by using the left and right arrows on the navigation toolbar. Alternatively, you can choose a specific date (such as a date that there is no trip scheduled) with the calendar icon at the top right.
...
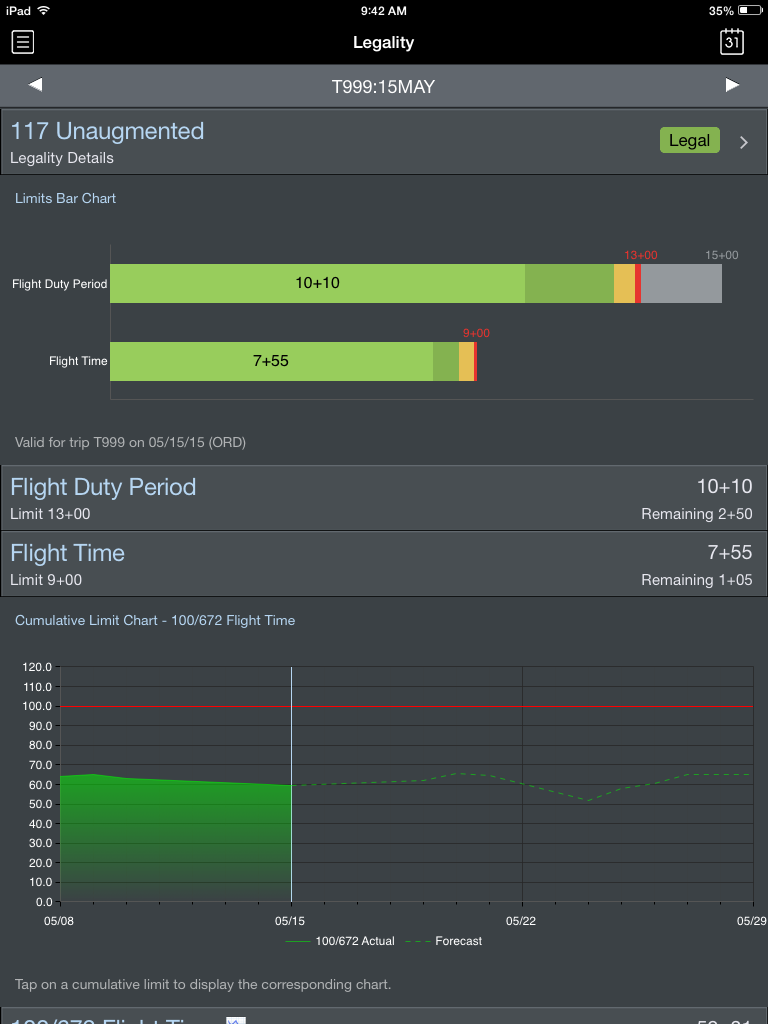
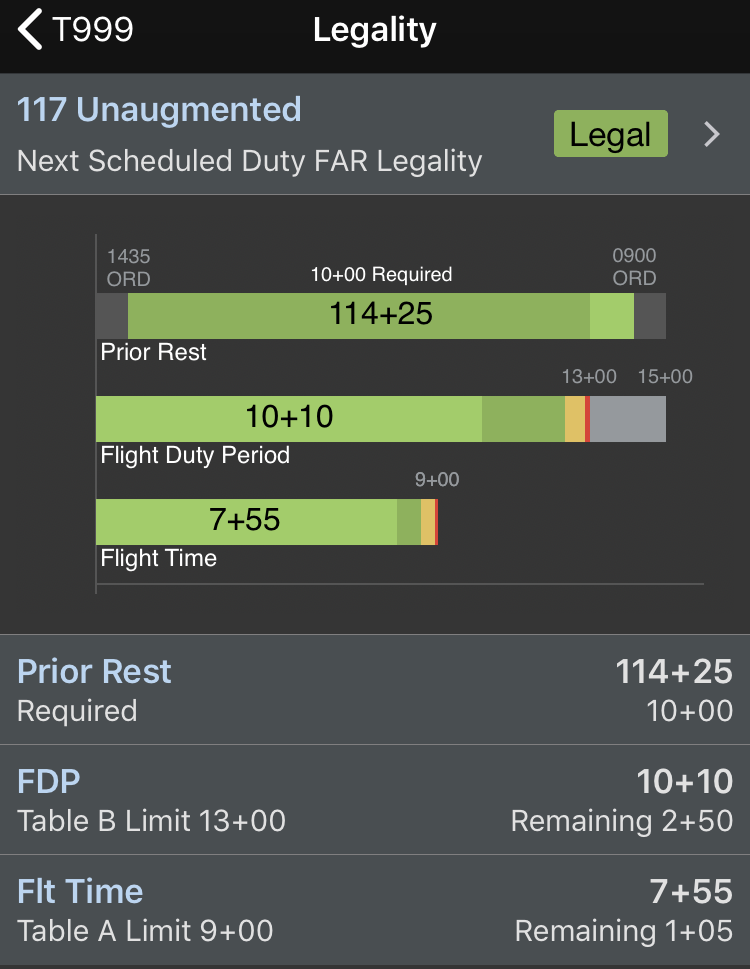
The flight time and duty time limits bar chart consists of two horizontal bar charts. These bar charts are color coded to indicate the applicable limits for the selected duty period, as well as your scheduled, actual, or projected values as applicable.
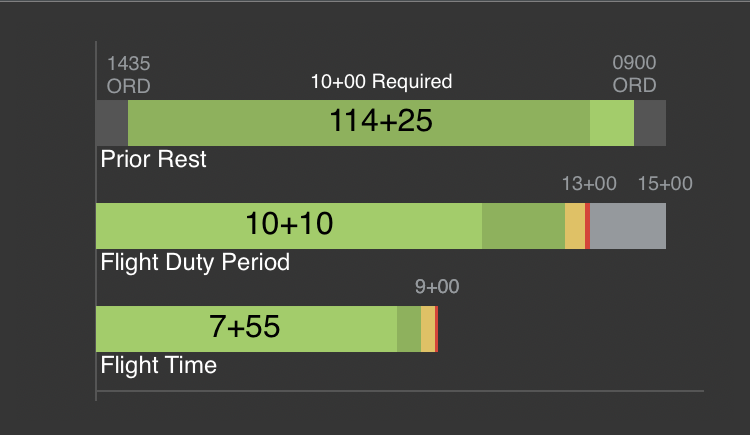
In the example above, the rest prior to this FDP is scheduled to be 114+25 which is indicated by the dark green shading. The minimum required amount of rest of 10+00 is represented by the light green shading.
The scheduled FDP is 10+10 and the FDP limit is 13+00. The scheduled FDP is indicated by a light green color on the bar chart. The limit of 13+00 is indicated by a red line on the chart and “13+00” is displayed above that line. A yellow zone is displayed to indicate a caution zone just prior to reaching the limit. The dark green area proportionally indicates the amount of time remaining between the scheduled time and the yellow zone. This allows you to quickly determine your proximity to the limits. The gray zone to the right of the red line indicates a 2 hour FDP extension would be legal up to a maximum of 15+00. If the scheduled time enters the yellow zone, the entire bar will turn yellow while exceeding the red limit will cause the entire bar to turn red.
...
Values displayed on each chart are calculated relative to each day on the chart. Dates in the past or with flights already flown are calculated using actual block values and are indicated by a shaded green area on the chart. Dates in the future or with flights not yet flown are forecast using actual and scheduled block times and are indicated by a dashed green line on the chart. The vertical blue line indicates the day currently being displayed. The horizontal red line indicates the applicable cumulative limit.
...
| Note | ||
|---|---|---|
| ||
While this documentation page is NOT intended to be used as an official reference to FAR 117, the following excerpts from FAR 117.23 are current as of this writing and are used here for purposes of clarifying how APDL calculates cumulative limits. |
FAR 117.23 states
"(b) No certificate holder may schedule and no flightcrew member may accept an assignment if the flightcrew member's total flight time will exceed the following:
...
(2) 190 flight duty period hours in any 672 consecutive hours."
According to FAR 117.23 above, you cannot accept an assignment if your flight or duty time "will exceed" any of these specific limits. For this reason, APDL treats each leg as an "assignment" and calculates your cumulative limits as of the end of each leg in your duty period. APDL then compares each leg and determines the most restrictive limit, or in other words, the leg that yields the highest cumulative limit. The result of the most restrictive leg is the value displayed on the Legality Status page. This method also allows APDL to point out specifically which leg causes you to exceed a limit so you can determine an appropriate schedule change with your airline. This process is repeated as APDL calculates and displays each of the four cumulative limits individually.
...