


https://www.youtube.com/watch?v=Jc6V1BpGs_0&list=PLt5jhPpkokeL7jZrgoINs1synCP7F3iAy&index=11
Graph
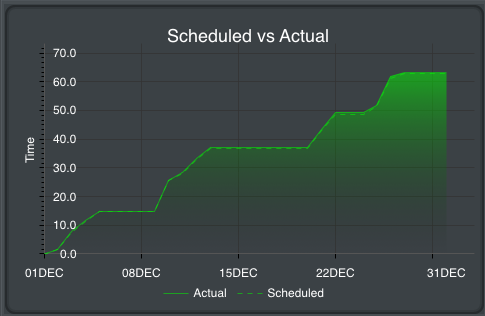
The summary graph shows your scheduled versus actual block time per month. Dates in the past are calculated using actual block values and are indicated by a shaded green area on the graph. Dates in the future are forecast using actual and scheduled block times and are indicated by a dashed green line on the graph.
Chart
After the graph you will find specific summary information broken down into various items. On iPhone this chart is below the graph while on iPad it is beside the graph.
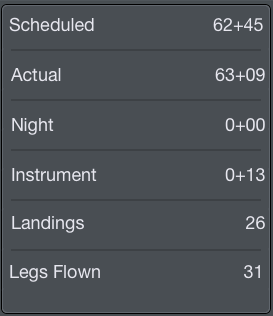
Among these items are:
- Scheduled Block in hours and minutes
- Actual Block in hours and minutes
- Night time in hours and minutes
- Instrument time in hours and minutes
- Landings
- Legs Flown
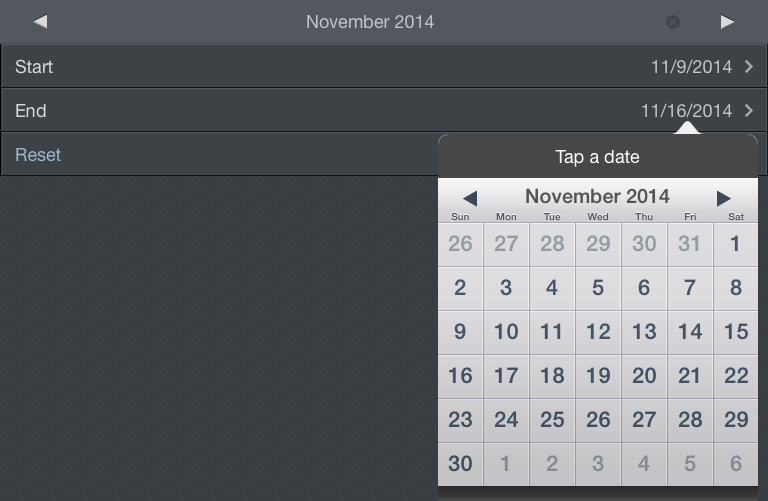
Date Range
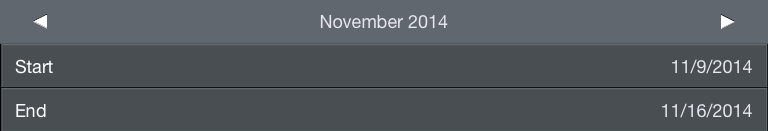
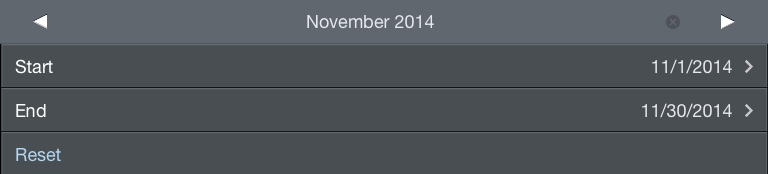
With customizable date ranges, APDL can display multiple date ranges. The graph displays the current month by default when first opened. The month being displayed is shown at the top of the screen along with the beginning and end date. You can display a different month by tapping the arrows to the left and right of the month name. Tap the "Today" button at the top right which shows the current date to instantly view the current month. The date range can be customized if you wish to display any period of time other than a single month. Tap the edit button at the top right to enter edit mode. The edit button looks like a calendar icon. Tapping the start and end date rows will open a calendar and you can manually select dates for your custom range. Your custom date range can be renamed by tapping the month name above the start date. The reset button will set the start and end dates to the first and last day of the month. Tap done to exit edit mode and return to the graph display. A note at the very bottom of the page shows the specific dates, times, and time zone used to determine currently displayed values.![]()
![]()

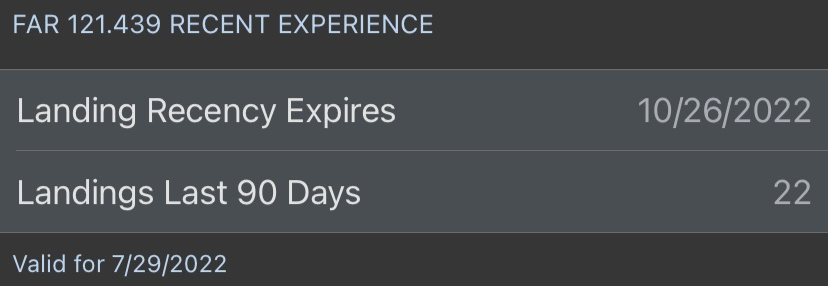
Recent Experience
The Recent Experience section shows your landings within the last 90 days and when your landing recency will expire. This is also available on the Alerts view as well as the Legality Detail view.
Trip Details
Below the chart area is a section containing specific trip details. This section is collapsed by default. Tapping the Trip Details row will expand it.
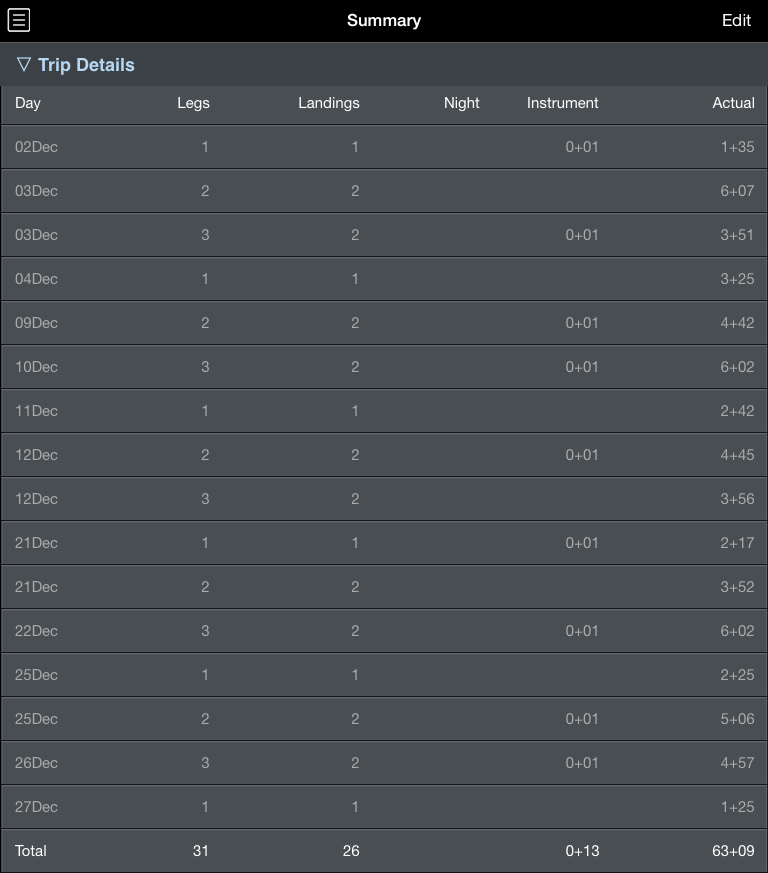
The Trip Details section displays summary information for every day with data entered into APDL. Available data includes:
- Number of legs
- Number of landings
- Night time in hours and minutes
- Instrument time in hours and minutes
- Total block in hours and minutes
The last row of the Trip Details section displays the grand total of each column for the entire date range.
Note
Number of legs displayed in the Trip Details section is NOT the same as the number of segments for determining FAR 117 Table B limits!
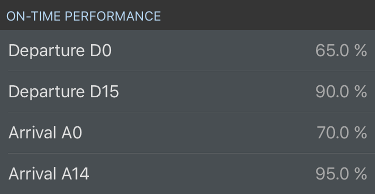
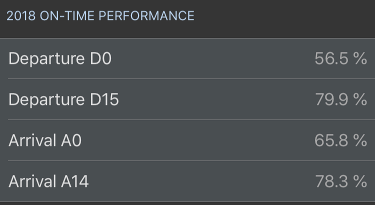
On Time Performance
In the On Time Performance section, you can view your performance percentages broken down into the common DOT tracked metrics. These metrics include only flights you actually flew (not deadheads). On Time Performance is also displayed in the year to date summary below.
Year to Date Summary
The bottom of the Summary Page displays a Year to Date Summary. This section is always visible regardless of the Trip Details section above being collapsed or expanded. The year is based on the current date range and is displayed in blue.
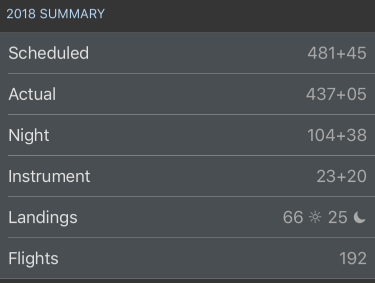
You will find specific yearly summary information broken down into various items. Among these items are:
- Scheduled Block in hours and minutes
- Actual Block in hours and minutes
- Night time in hours and minutes
- Instrument time in hours and minutes
- Day and night landings
- Number of flights flown
- Year-to-date On Time Performance