Logbook Pro offers a unique and simple way to view all of your data within one area, the Logbook Pro Explorer. Modeled after the Windows Explorer interface, the Explorer is used by simply clicking the nodes (text information) on the left side, then view the information on the right side. Display options are available by clicking the Options icon (far left) of the Sub Toolbar such as grid line styles and row shading.
When viewing data, such as logbook data, click a row on the right and the row will become highlighted for easy viewing. Column widths are adjustable just as in the data entry areas by clicking and dragging the row divider to the right of the column desired. The logbook area will configure itself to match that of the Spreadsheet Style log to make the interface simpler to read between data areas. Data cannot be edited in the Explorer, it is only a place for viewing existing data (read-only).
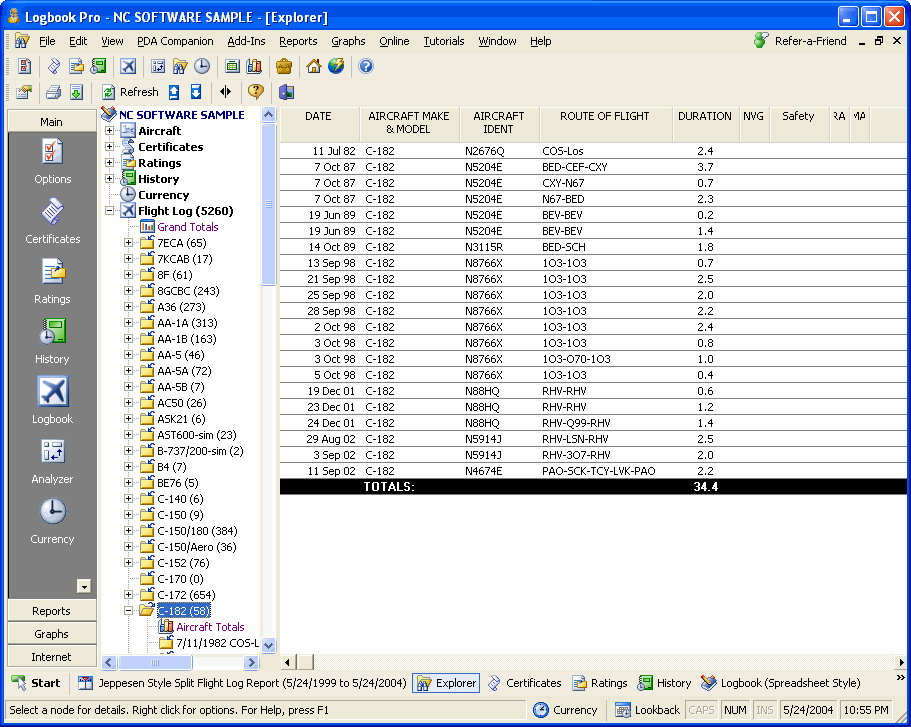
The Explorer offers a powerful capability for analyzing data as well. Figure 1 below shows the summary capability in the logbook area, providing a grand total overall as well as grand total summaries by aircraft type. At the bottom of each node of logbook data is a summary line, showing the totals for each column if the user actually wants to view the data with a summary below.
Figure 1. Explorer with Summary Info
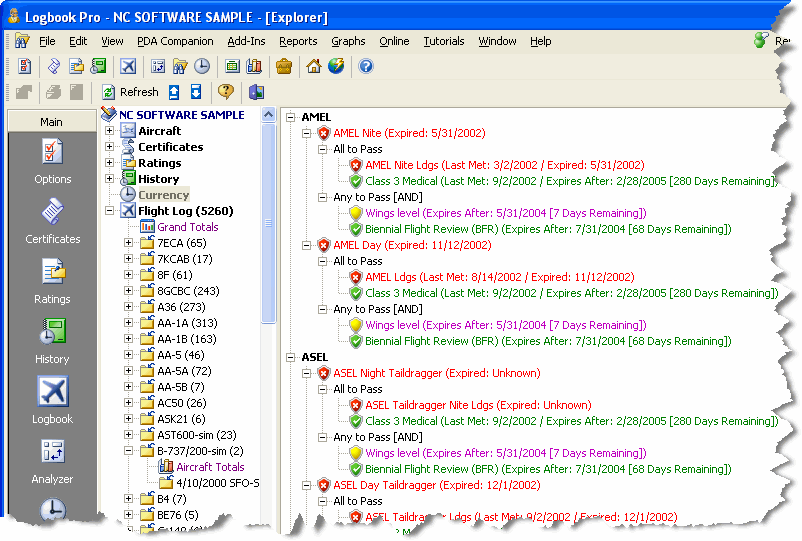
Currencies can be closely analyzed by viewing the data and determining fail points by clicking the plus symbols to branch down each currency configuration as shown in Figure 2. Color coding applied for easy viewing.
Figure 2. Explorer Currency Detail
All areas except the currency area benefit from the ability to print and export, should you want to capture the data or transport it to another analytical system such as Microsoft Excel. Enjoy the Logbook Pro Explorer, it is a very powerful system for viewing your data.
Figure 1. Explorer Sub-Toolbar
Left to Right Description of the buttons available on the Explorer Toolbar shown above:
Options: Click to view a drop down menu of configuration settings pertaining to the Explorer
Print: Prints the data shown on the right side of the Explorer, i.e. logbook information, etc.
Export: Click to view a drop down menu of available export options for the node selected
Refresh: Updates the data for the node selected
Collapse Nodes: Collapses all nodes on the left side of the Explorer as if clicking the minus sign next to each node
Expand Nodes: Expands all nodes on the left side of the Explorer as if clicking the plus sign next to each node
Freeze Columns: Columns left of the splitter bar are fixed in position, right side will scroll
Help: Displays the Help Documentation for the Explorer
Close: Closes the Explorer Window


