Logbook Pro offers the most powerful graphing/charting of any software package. Using a high speed data analysis engine, a visual representation of your data is displayed in approximately one second. Completely interactive, refer to the Tips and Tricks section of this help documentation to learn how the graph can be manipulated in 3D or zooming and scaling effects performed. Graph styles include vertical bar charts, horizontal bar charts, and pie charts. Graphs are completely customizable in formatting from colors, legends, grid lines, and value displays. Logbook Pro offers the continued support for export offering export to JPEG Bitmap graphics (.JPG), Portable Network Graphs (.PNG) and even creates a web page for you, exporting to a .HTM file. Figure 1 below shows an example of a bar chart and the general layout of a graph.

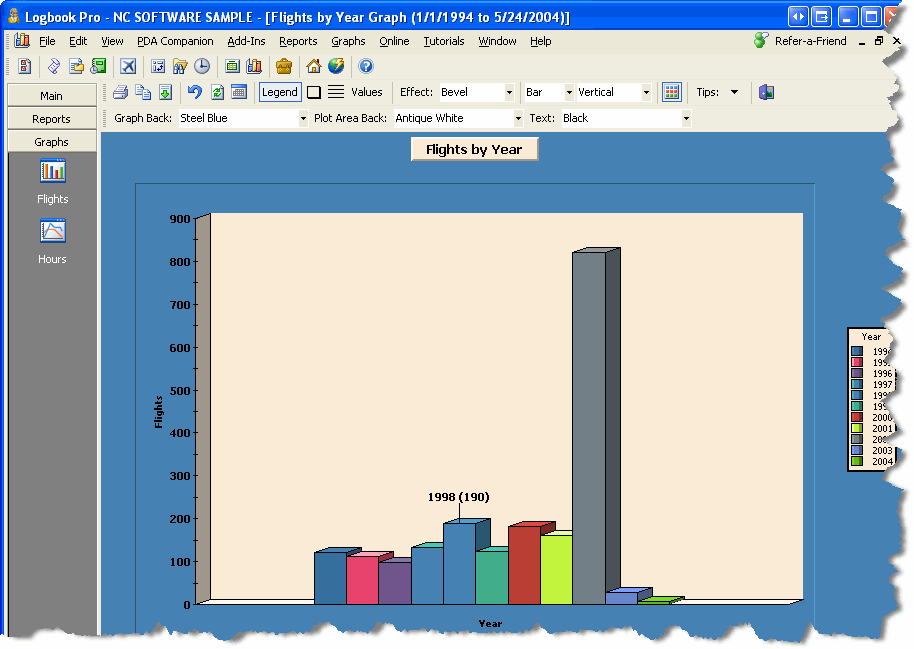
Figure 1. Vertical Bar Chart
The graph toolbar, as well as the right-click popup menu provide a plethora of user-configurable options. When first starting the presentation of graph data, a date filter window, as shown in Figure 2 below, will appear, allowing the complete flexibility in filtering the data per the users desire. A date filter change can occur by clicking the calendar icon on the toolbar allowing the immediate query of a new date range. 3D effects can be modified as well as color formatting, which are remembered for each individual graph displayed, recalled for future calls of the same data.

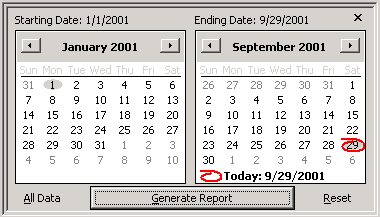
Figure 2. Date Filter
...
Pie charts are also viewable by changing the selection from the main graph toolbar, above the graph area. Figure 3 below shows an example of a pie chart.

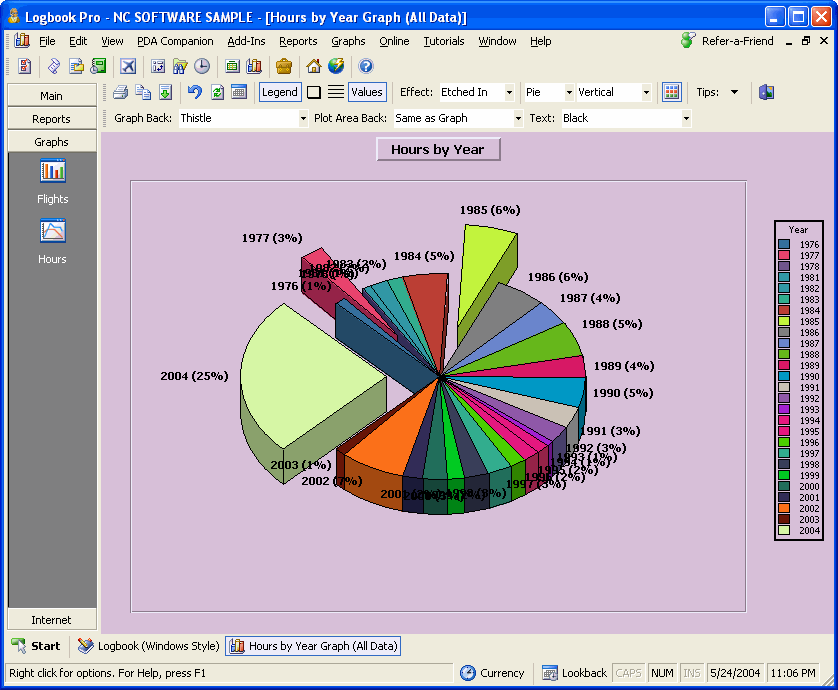
Figure 3. Pie Chart
...