...
Anchor Productivity Forecast Date Range Productivity Forecast Date Range
Date Range
| Productivity Forecast Date Range | |
| Productivity Forecast Date Range |
| Excerpt |
|---|
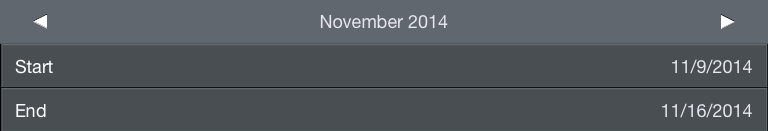
With customizable date ranges, APDL can display multiple date ranges. The graph displays the current month by default when first opened. The month being displayed is shown at the top of the screen along with the beginning and end date. You can display a different month by tapping the arrows to the left and right of the month name. Tap the "Today" button at the top right which shows the current date to instantly view the current month. The date range can be customized if you wish to display any period of time other than a single month. |
...
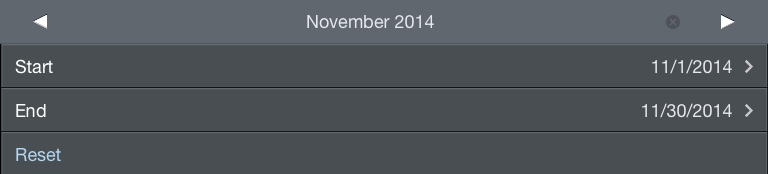
Tap the edit button at the top right to enter edit mode. The edit button looks like a calendar icon.
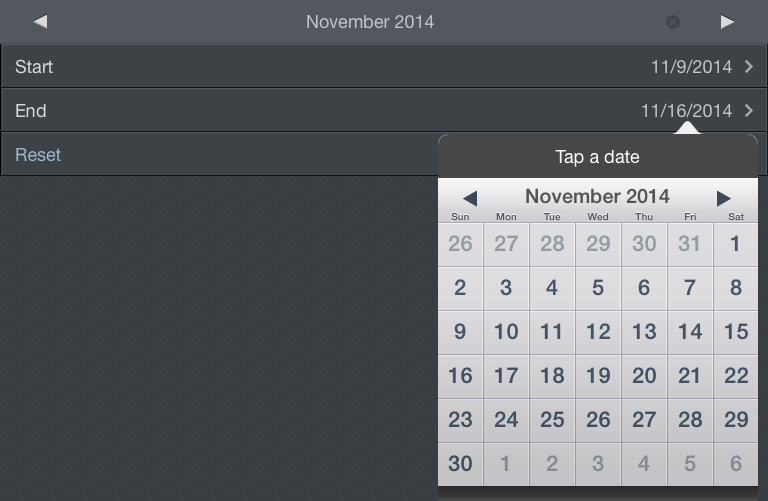
Tapping the start and end date rows will open a calendar and you can manually select dates for your custom range. Your custom date range can be renamed by tapping the month name above the start date. The reset button will set the start and end dates to the first and last day of the month. Tap done to exit edit mode and return to the graph display.
A note at the very bottom of the page shows the specific dates, times, and time zone used to determine currently displayed values.
|

Anchor Productivity Forecast Block and FDP Availability Productivity Forecast Block and FDP Availability
Block and FDP Availability
| Productivity Forecast Block and FDP Availability | |
| Productivity Forecast Block and FDP Availability |
...